Click to join our free beta! >>
Blog Posts
Building a Modern Crash Debugger
Sept 16, 2026
I've spent countless hours over the years debugging Windows crashes with tools that were either friendly but limited (e.g. Visual Studio) or powerful but archaic (e.g. WinDbg). My experience let me develop patterns and methods for understanding what was going on, and I decided that they could be leveraged into a much more effective debugging tool.
When a process crashes, its memory is a crime scene. Modules, regions, stack frames, symbols, and heap allocations can all provide clues as to what went wrong. My goal for ForensicDbg was simple: to be able to look at any address in memory and understand it instantly. Not as hex bytes, but as what it actually represents: interpreted, annotated, and linked to everything around it.

ForensicDbg is built on a small set of established libraries: wxWidgets for the interface, the DIA SDK for reading PDBs, Zydis for disassembly, and ANTLR4 for a C-like expression parser. EASTL provides fast implementations of data structures needed for doing analysis on multiple threads. These time-tested libraries mean I can spend most of my time on the more directly relevant engineering: reconstructing and interpreting the crash data.
Reconstructing and Analyzing Memory
A minidump is, almost by definition, incomplete since it captures only a subset of the process's memory. Read-only, unmodified pages (an executable's own code and constant data) are routinely left out to keep the dump small, since in theory they can be recovered from the original binary. But in practice, recovering them means replaying what the OS loader did when each module was loaded. ForensicDbg emulates that loader to reconstruct regions left out of the dump, performing the same relocations and import-table fixups the OS loader would have.
Reconstructing memory is only part of the problem. You also need to be able to figure out what's in it. Symbols get you a name and a type when the PDB has one, but plenty of the interesting data in a crash dump has no symbol information. As an example, heap allocations do not record what type of data they contain. ForensicDbg walks back through the chain of references to figure out "what is this, really?" First looking at symbols, then vtables, then heap allocation metadata, then whatever previously-resolved reference pointed here.
These passes allow the debugger to quickly and accurately label memory a human would have had to spend time figuring out by hand.

Validating Call Stacks
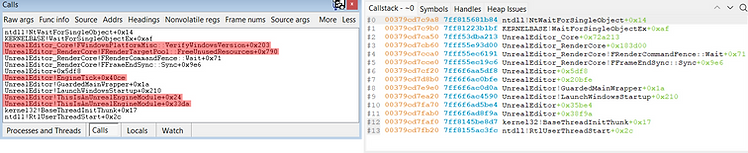
Windows provides a StackWalk64 call to unwind a call stack, and most of the time it does a good job, but ForensicDbg doesn't just take its word for it: every frame gets checked. Does the stack pointer move in the right direction? Does the instruction pointer reference an executable region? When the native unwinder returns a frame that fails those checks (or just fails outright), ForensicDbg scans the stack for plausible return addresses and checks that they contain a call back to the current function. Only then does the stack frame get accepted as real.
When symbolicating frames, ForensicDbg makes sure that the instruction pointer is actually contained within the function reported. We have all seen callstacks with "MisleadingFunctionName+UnreasonablyLargeOffset", so ForensicDbg would rather not display a symbol than display the wrong one.
Foundation for AI Debugging
Full disclosure: I'm careful about how much I rely on AI because I don't want to weaken my own ability to reason through a problem independently. I'm also very aware that AI can produce confident, plausible-sounding answers that happen to be wrong, and that a debugger that returns incorrect information will lose the trust of its users. Because of that, ForensicDbg doesn't use AI internally for any of its data processing.
Where AI genuinely helps is after the tedious yet ascertainable work of gathering and cross-checking evidence is already done. When you stack imperfect assumptions on top of each other, the errors compound fast. But if you give AI a solid foundation of data that's already been interpreted and labeled, it can spend its effort on the parts of the problem that benefit from broad, fuzzy reasoning. This means getting better results more efficiently.
ForensicDbg now exposes its debugging engine, with the same reconstructed modules, validated stacks, and inferred types, to any AI tool that speaks stdio MCP. You can point an AI agent at a crash dump and let it work from ForensicDbg’s improved and interlinked data.
This works surprisingly well. The interpretation and labeling built for the GUI is exactly what an LLM needs, and for the same reasons a human does. Raw hex is expensive to evaluate; pre-digested, labeled, linked data isn't. Handing an agent already-interpreted data means it spends its tokens on actual analysis instead of re-deriving what the debugger already worked out. It also prevents that early foundation of processed data from being littered with convincing guesses.

ForensicDbg is a post-mortem debugger for Windows built around the idea that a crash needs to be investigated like the intricate crime scene it is. It handles x86 and x64 crash dumps, attaches to live processes, and can operate as your system's just-in-time debugger so it can be on the scene when a crash happens. It's in active development with new capabilities landing regularly, so it’s worth a look if you spend time staring at crashes.